
Industry Statistics and Trends
Market size and recent performance (2015-2030)
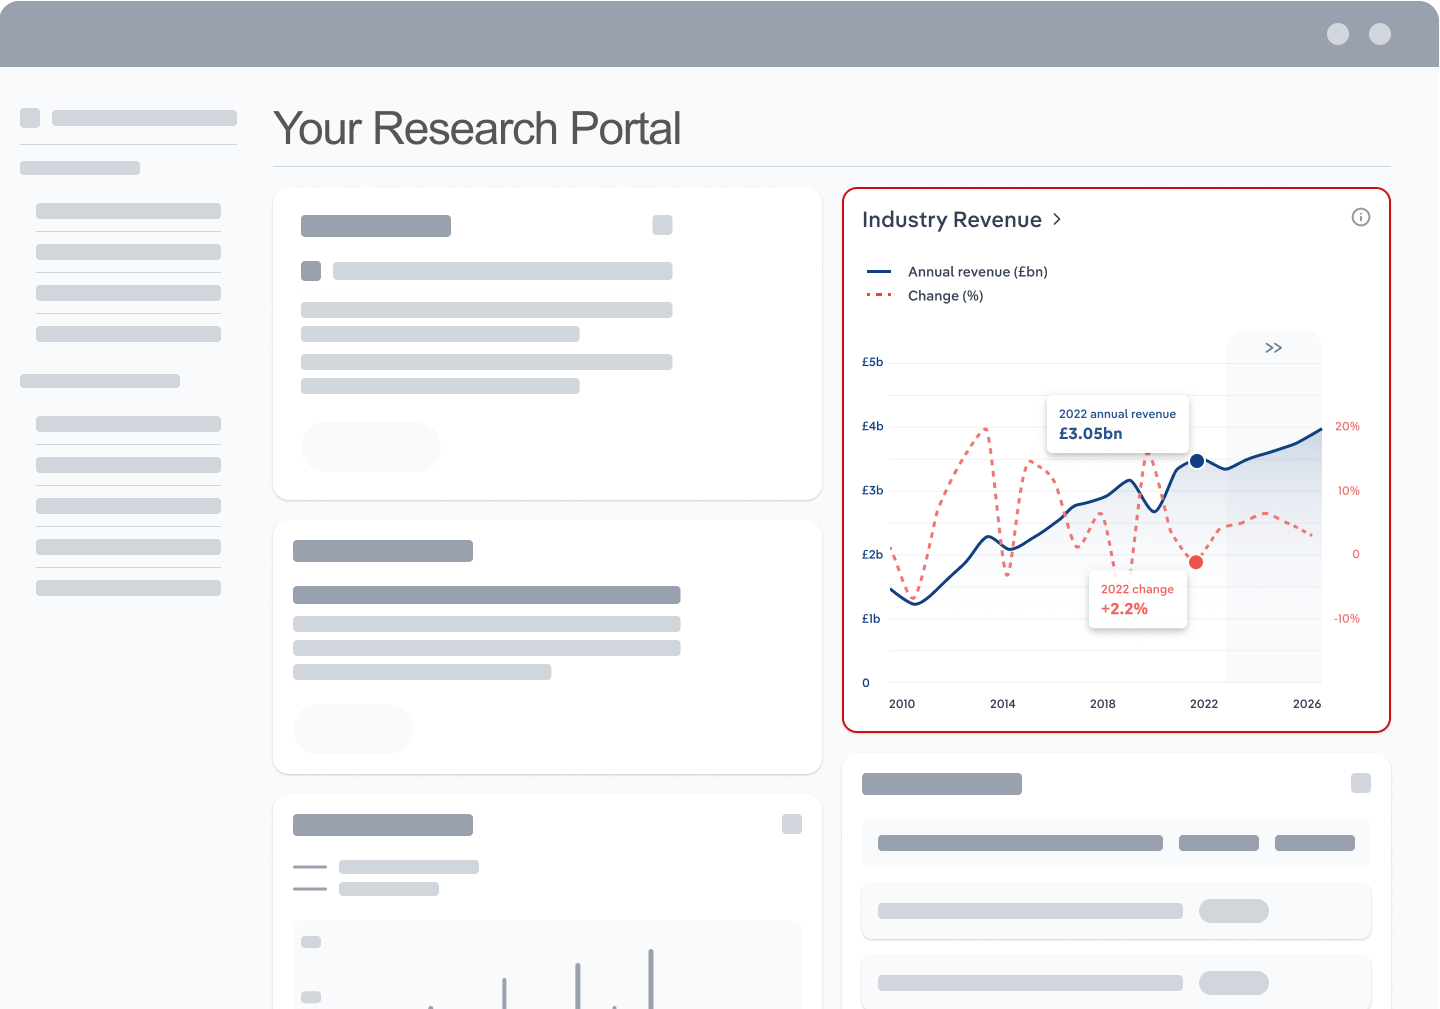
Industry revenue has grown at a CAGR of 1.3 % over the past five years, to reach an estimated $5.7bn in 2025.
Trends and Insights
Heavy truck sales remain historically strong despite cooling volumes
- Heavy-duty trucks have been the backbone of industry growth across 2023 and early 2024. According to Truck Industry Council (TIC) data, a record 51,772 new trucks and heavy vans were delivered in 2023, driven by a strong performance in the heavy-duty segment. This spike was largely driven by post-pandemic fleet renewal, a catch-up in deliveries delayed by prior supply shortages and continued investment in road freight assets by major transport operators.
- Additional trends and insights available with purchase
Industry outlook (2025-2030)
Market size is projected to grow over the next five years.
Trends and Insights
Freight demand from key sectors underpins long-term truck sales
- Ongoing demand from freight-intensive sectors like mining, agriculture, construction and logistics is expected to support truck dealer revenue growth over the next five years. The road freight sector remains the Truck Dealers industry's largest market, with operators steadily upgrading fleets in response to infrastructure builds, growing freight volumes and customer expectations for reliability. Australia's expansive geography ensures that long-haul road transport remains essential across supply chains.
Biggest companies in the Truck Dealers in Australia
| Company | Market Share (%)
2026 | Revenue ($m)
2026 |
|---|---|---|
Velocity Vehicle Group Topco | 346.8 | |
Eagers Automotive | 117.8 | |
The Brown & Hurley Group | 141.0 |
To view the market share and analysis for all 3 top companies in this industry, view purchase options.
Products & Services Segmentation
Industry revenue is measured across several distinct product and services lines, including Light trucks, Heavy trucks and Medium trucks. Light trucks is the largest segment of the Truck Dealers in Australia.
Trends and Insights
Heavy truck sales have hiked as many businesses have upgraded their fleets
- Heavy trucks, defined by high axle loads and Gross Combination Mass (GCM) over 39 tonnes, represent the most valuable product segment for truck dealers. These vehicles are typically purchased by long-haul freight operators, mining contractors and infrastructure firms.
- More insights available in the full report
Table of Contents
About this industry
Industry definition
Truck dealers sell new and used light-, medium- and heavy-duty trucks. The sale of trucks excludes the sale of truck semitrailers, vans and utility vehicles. The industry's activities also exclude repair and maintenance services, as well as the sale of truck parts and other aftermarket services.
What's included in this industry?
Products and services covered in the Truck Dealers industry in Australia include Light rigid trucks, Heavy rigid trucks and Medium rigid trucks .Companies
Companies covered in the Truck Dealers industry in Australia include Velocity Vehicle Group Topco, Eagers Automotive and The Brown & Hurley Group.Purchase this report to view all 3 major companies in this industry.
Related Terms
Related terms covered in the Truck Dealers industry in Australia include gross vehicle mass (gvm), gross combination mass (gcm) , truck, divestment and oem (original equipment manufacturer) .Industry Code
ANZSIC 3911 - Truck Dealers in Australia
Performance
Get an indication of the industry's health through historical, current and forward-looking trends in the performance indicators that make or break businesses.
Analyst insights
Truck dealers are experiencing softer demand after record sales in 2023-24. A post-pandemic fleet upgrade cycle and freight surge drove peak sales, but rising costs and norma...
In this chapter (4)
- Current Performance
- Outlook
- Volatility
- Life Cycle
Key metrics
- Annual Revenue, Recent Growth, Forecast, Revenue Volatility
- Number of Employees, Recent Growth, Forecast, Employees per Business, Revenue per Employee
- Number of Businesses, Recent Growth, Forecast, Employees per Business, Revenue per Business
- Total Profit, Profit Margin, Profit per Business
Charts
- Revenue, including historical (2015-2024) and forecast (2025-2030)
- Employees, including historical (2015-2024) and forecast (2025-2030)
- Businesses, including historical (2015-2024) and forecast (2025-2030)
- Profit, including historical (2015-2025)
- Industry Volatility vs. Revenue Growth
- Industry Life Cycle
Detailed analysis
- Trends in supply, demand and current events that are driving current industry performance
- Expected trends, economic factors and ongoing events that drive the industry's outlook
- Key success factors for businesses to overcome volatility
- How contribution to GDP, industry saturation, innovation, consolidation, and technology and systems influence the industry's life cycle phase.
Products and Markets
Learn about an industry's products and services, markets and trends in international trade.
Analyst insight
Intense external competition is reducing demand for light-duty trucks. This segment has diminished as a share of industry revenue as consumer preferences have shifted from li...
In this chapter
- Products & Services
- Major Markets
Key metrics
- Largest market segment and value in 2025
- Product innovation level
Charts
- Products & services segmentation in 2025
- Major market segmentation in 2025
Detailed analysis
- Trends impacting the recent performance of the industry's various segments
- Innovations in the industry's product or service offering, specialization or delivery method
- Key factors that successful businesses consider in their offerings
- Buying segments and key trends influencing demand for industry products and services
Geographic Breakdown
Discover where business activity is most concentrated in an industry and the factors driving these trends to find opportunities and conduct regional benchmarking.
Analyst insights
Access to major markets is a significant determinant for dealerships' location. Queensland is over-represented, as heavier trucks are used to support sectors like constructio...
In this chapter (1)
- Business Locations
Charts
- Share of revenue, establishment, wages and employment in each region
- Share of population compared to establishments in each region in 2025
Tables
- Number and share of establishments in each region in 2025
- Number and share of revenue each region accounts for in 2025
- Number and share of wages each region accounts for in 2025
- Number and share of employees in each region in 2025
Detailed analysis
- Geographic spread of the industry across Asia Pacific, and trends associated with changes in the business landscape
- Key success factors for businesses to use location to their advantage
Competitive Forces
Get data and insights on what's driving competition in an industry and the challenges industry operators and new entrants may face, with analysis built around Porter's Five Forces framework.
Analyst insights
Many small truck dealers compete in the Truck Dealers industry. That's why market share concentration is low and internal competition is intense.
In this chapter (4)
- Concentration
- Barriers to Entry
- Substitutes
- Buyer & Supplier Analysis
Key metrics
- Industry concentration level
- Industry competition level and trend
- Barriers to entry level and trend
- Substitutes level and trend
- Buyer power level and trend
- Supplier power level and trend
Charts
- Market share concentration among the top 4 suppliers from 2020-2025
- Supply chain including upstream supplying industries and downstream buying industries, flow chart
Detailed analysis
- Factors impacting the industry’s level of concentration, such as business distribution, new entrants, or merger and acquisition activity.
- Key success factors for businesses to manage the competitive environment of the industry.
- Challenges that potential industry entrants face such as legal, start-up costs, differentiation, labor/capital intensity and capital expenses.
- Key success factors for potential entrants to overcome barriers to entry.
- Competitive threats from potential substitutes for the industry’s own products and services.
- Key success factors for how successful businesses can compete with substitutes.
- Advantages that buyers have to keep favorable purchasing conditions.
- Advantages that suppliers have to maintain favorable selling conditions.
- Key success factors for how businesses can navigate buyer and supplier power.
Companies
Learn about the performance of the top companies in the industry.
Analyst insights
Velocity Truck Centres is the industry’s largest player but not a dominant force. Its national footprint and brand representation are broad, yet the fragmented dealer network...
In this chapter
- Market Share Concentration
- Companies
- Company Spotlights
Charts
- Industry market share by company in 2021 through 2025
- Major companies in the industry, including market share, revenue, profit and profit margin in 2025
- Overview of Velocity Vehicle Group Topco's performance by revenue, market share and profit margin from 2019 through 2025
- Overview of Eagers Automotive's performance by revenue, market share and profit margin from 2019 through 2025
- Overview of The Brown & Hurley Group's performance by revenue, market share and profit margin from 2019 through 2025
Detailed analysis
- Description and key data for Velocity Vehicle Group Topco, and factors influencing its performance in the industry
- Description and key data for Eagers Automotive, and factors influencing its performance in the industry
- Description and key data for The Brown & Hurley Group, and factors influencing its performance in the industry
External Environment
Understand the demographic, economic and regulatory factors that shape how businesses in an industry perform.
Analyst insights
Capital intensity in the Truck Dealers industry is moderate. Labour costs outweigh capital costs as skilled salespeople are necessary for success.
In this chapter
- External Drivers
- Regulation & Policy
- Assistance
Key metrics
- Regulation & policy level and trend
- Assistance level and trend
Charts
- Regulation & Policy historical data and forecast (2015-2030)
- Assistance historical data and forecast (2015-2030)
Detailed analysis
- Demographic and macroeconomic factors influencing the industry, including Regulation & Policy and Assistance
- Major types of regulations, regulatory bodies, industry standards or specific regulations impacting requirements for industry operators
- Key governmental and non-governmental groups or policies that may provide some relief for industry operators.
Financial Benchmarks
View average costs for industry operators and compare financial data against an industry's financial benchmarks over time.
Analyst insights
The rising relative cost of motor vehicles is driving up profit margins. Truck dealers' profitability has expanded over the past few years as the number of sales hikes and th...
In this chapter
- Cost Structure
- Financial Ratios
- Key Ratios
Key metrics
- Profit margin, and how it compares to the sector-wide margin
- Average wages, and how it compares to the sector-wide average wage
- Largest cost component as a percentage of revenue
- Industry average ratios for days' receivables, industry coverage and debt-to-net-worth ratio
Charts
- Average industry operating costs as a share of revenue, including purchases, wages, depreciation, utilities, rent, other costs and profit in 2025
- Average sector operating costs as a share of revenue, including purchases, wages, depreciation, utilities, rent, other costs and profit in 2025
- Investment vs. share of economy
Data tables
- Cash Flow & Debt Service Ratios (2015-2030)
- Revenue per Employee (2015-2030)
- Revenue per Enterprise (2015-2030)
- Employees per Establishment (2015-2030)
- Employees per Enterprise (2015-2030)
- Average Wage (2015-2030)
- Wages/Revenue (2015-2030)
- Establishments per Enterprise (2015-2030)
- IVA/Revenue (2015-2030)
- Imports/Demand (2015-2030)
- Exports/Revenue (2015-2030)
Detailed analysis
- Trends in the cost component for industry operators and their impact on industry costs and profitability
Key Statistics
Industry Data
Data Tables
Including values and annual change:
- Revenue (2015-2030)
- IVA (2015-2030)
- Establishments (2015-2030)
- Enterprises (2015-2030)
- Employment (2015-2030)
- Exports (2015-2030)
- Imports (2015-2030)
- Wages (2015-2030)
Top Questions Answered
Unlock comprehensive answers and precise data upon purchase. View purchase options.
What is the market size of the Truck Dealers industry in Australia in 2025?
The market size of the Truck Dealers industry in Australia is $5.7bn in 2025.
How many businesses are there in the Truck Dealers industry in Australia in 2025?
There are 267 businesses in the Truck Dealers industry in Australia, which has declined at a CAGR of 1.2 % between 2020 and 2025.
How may import tariffs affect the Truck Dealers industry in Australia?
The Truck Dealers industry in Australia is unlikely to be materially impacted by import tariffs with imports accounting for a low share of industry revenue.
How may export tariffs affect the Truck Dealers industry in Australia?
The Truck Dealers industry in Australia is unlikely to be materially impacted by export tariffs with exports accounting for a low share of industry revenue.
Has the Truck Dealers industry in Australia grown or declined over the past 5 years?
The market size of the Truck Dealers industry in Australia has been growing at a CAGR of 1.3 % between 2020 and 2025.
What is the forecast growth of the Truck Dealers industry in Australia over the next 5 years?
Over the next five years, the Truck Dealers industry in Australia is expected to grow.
What are the biggest companies in the Truck Dealers industry in Australia?
The biggest companies operating in the Truck Dealers industry in Australia are Velocity Vehicle Group Topco, Eagers Automotive and The Brown & Hurley Group
What does the Truck Dealers industry in Australia include?
Light rigid trucks and Heavy rigid trucks are part of the Truck Dealers industry in Australia.
Which companies have the highest market share in the Truck Dealers industry in Australia?
The company holding the most market share in the Truck Dealers industry in Australia is Velocity Vehicle Group Topco.
How competitive is the Truck Dealers industry in Australia?
The level of competition is high and increasing in the Truck Dealers industry in Australia.
Methodology
How are IBISWorld reports created?
IBISWorld has been a leading provider of trusted industry research for over 50 years to the most successful companies worldwide. With offices in Australia, the United States, the United Kingdom, Germany and China, we are proud to have local teams of analysts that conduct research, data analysis and forecasting to produce data-driven industry reports.
Our analysts start with official, verified and publicly available sources of data to build the most accurate picture of each industry. Analysts then leverage their expertise and knowledge of the local markets to synthesize trends into digestible content for IBISWorld readers. Finally, each report is reviewed by one of IBISWorld’s editors, who provide quality assurance to ensure accuracy and readability.
IBISWorld relies on human-verified data and human-written analysis to compile each standard industry report. We do not use generative AI tools to write insights, although members can choose to leverage AI-based tools within the platform to generate additional analysis formats.
What data sources do IBISWorld analysts use?
Each industry report incorporates data and research from government databases, industry-specific sources, industry contacts, and our own proprietary database of statistics and analysis to provide balanced, independent and accurate insights.
Key data sources in Australia include:
- Australian Bureau of Statistics
- Australian Taxation Office
- Australian Securities & Investments Commission
Analysts also use industry specific sources to complement catch-all sources, although their perspective may focus on a particular organization or representative body, rather than a clear overview of all industry operations. However, when balanced against other perspectives, industry-specific sources provide insights into industry trends.
These sources include:
- Industry and trade associations
- Industry federations or regulators
- Major industry players annual or quarterly filings
Finally, IBISWorld’s global data scientists maintain a proprietary database of macroeconomic and demand drivers, which our analysts use to help inform industry data and trends. They also maintain a database of statistics and analysis on thousands of industries, which has been built over our more than 50-year history and offers comprehensive insights into long-term trends.
How does IBISWorld forecast its data?
IBISWorld’s analysts and data scientists use the sources above to create forecasts for our proprietary datasets and industry statistics. Depending on the dataset, they may use regression analysis, multivariate analysis, time-series analysis or exponential smoothing techniques to project future data for the industry or driver. Additionally, analysts will leverage their local knowledge of industry operating and regulatory conditions to impart their best judgment on the forecast model.
IBISWorld prides itself on being a trusted, independent source of data, with over 50 years of experience building and maintaining rich datasets and forecasting tools. We are proud to be the keystone source of industry information for thousands of companies across the world.
Learn more about our methodology and data sourcing on the Help Center.